The short version
"Fuel savings" can hide four different effects, and a number that blends them cannot be audited. FuelGuru measures each one on its own and reports each on its own line. Every view described here is in your fuel savings dashboard, down to each truck's day timeline and map, and every figure rebuilds from gallons and cents per gallon on your own data.
| Measurement | The question it answers | Data it runs on |
|---|---|---|
| 1. Stop and day selection | Same trucks, same miles, same gallons burned: what would the fuel have cost if each truck had bought where and how much FuelGuru prescribes, among the stops the fleet already allows? | Card transactions, GPS, engine fuel level and odometer, the daily price file for every approved stop, yard prices |
| 2. In-network compliance | With FuelGuru in the driver workflow, what share of fuel is bought inside the approved network, and what did off-network fuel cost above the in-network price? | Card transactions, the approved stop list and yards, off-network receipts, GPS |
| 3. Prescription compliance | Did the driver fuel at the stop FuelGuru prescribed, and buy the gallons prescribed? | The active prescription at the time of purchase, card transactions, GPS |
| 4. Receipts that do not fit the truck | Which fills does the telematics record not support? | Receipts against GPS position and tank room |
Measurements 1 and 2 are the two savings levers, and neither contains the other. Measurement 3 is execution: a driver can be in network and still skip the better in-network stop. Measurement 4 is what keeps the first three honest. Add 1 and 2 on separate lines; never add 3 to either.
1. Stop and day selection
This is the lane analysis you receive before deployment and the scorecard you keep afterwards. It is a fair comparison by construction: the trip is not changed to claim a saving.
| Item | Definition |
|---|---|
| Unit | One truck, simulated continuously day by day from its first proven full tank to the end of the window. Each day: the GPS route as driven, the engine fuel level and odometer, the driver's fills from receipts, and FuelGuru's fills for the same day |
| Held constant | Truck, route, departure time, actual route stops as waypoints, gallons burned (engine-measured, calibrated to pump gallons per truck), tank size, the approved stop list plus yards, the fleet's fill policy and gallon floor. No route changes |
| Changed | Which stop on the list each truck buys at, on which day, and how much |
| Cost | Used-fuel cost: both sides burn the same gallons; each burned gallon is priced at what it was bought for. Fuel left in the tank at the end of the window is excluded on both sides, so neither side looks better for leaving prepaid fuel in the tank |
| Saving | Driver used-fuel cost less FuelGuru used-fuel cost. Trucks with a negative result are included in every fleet figure |
| Prices | Both sides buy at the fleet's negotiated card price at whichever brand the stop belongs to, and yards at the fleet's own yard cost. The gap comes from stop and day, not from a discount the fleet does not already hold |
The views. The scorecard: gallons burned, gallons bought on each side, used-fuel cost on each side, the saving as dollars and as a share of spend, and the gallon-weighted price paid per gallon on each side. Station mix: fills per thousand miles, average fill size, yard share of gallons, and every stop with a fill on either side with the gallon shift between them. Truck drill-down: every truck's own number, and when you open it, the day timeline (miles, gallons burned, fuel level at start and end, both sides' fills, the day's saving), the day map (the route as driven with both sides' fills on it, each with stop, gallons, price and the price at the alternative), and "why this stop" for each FuelGuru fill (the price gap, the tank level that made it reachable, the fill size that carries the truck to the next cheap stop). Stations and states: the state price ladder from your price file with each side's paid price per state. Summaries by month, state, stop and truck, with the same six columns: trips, gallons, actual dollars, prescribed dollars, saving dollars, saving percent.
A spend shift between states is not a saving
Under FuelGuru, spend leaves expensive home states and lands in cheaper states on the same lanes. The state summary shows that shift so you can see the mechanism. The saving is the used-fuel cost difference on the scorecard, not the sum of the state rows.
Read the number with its basis: a lane analysis before card data is connected runs on posted prices or your price sheet and is labeled modeled; the same view with the rate file and transactions connected is labeled measured. The label is on every financial figure in the dashboard.
2. In-network compliance
A separate lever, measured in production from card transactions: not which stop on the list, but whether the fuel was bought inside the approved network at all. Fuel bought outside the network is retail pump price with no card discount at stops the fleet did not negotiate, and the premium over the in-network price is where the production saving comes from.
| Term | Definition |
|---|---|
| In-network fill | Bought on the fleet card at an approved stop or a fleet yard. Every other fill, a retail pump off the list or a cash or personal-card fill, is off-network |
| In-network share | In-network fills divided by all fills on the trucks FuelGuru tracks, by month; also shown as gallons |
| Off-network premium | Price paid per off-network gallon less the in-network net card price the same day, gallon-weighted |
| Card discount | The fleet's negotiated discount off pump price at approved stops. It is part of the in-network price, not an addition to the saving |
| Saving against the starting month | Gallons multiplied by the rise in in-network share multiplied by the premium. The first month at fleet scale is taken as the fleet's own pattern before FuelGuru |
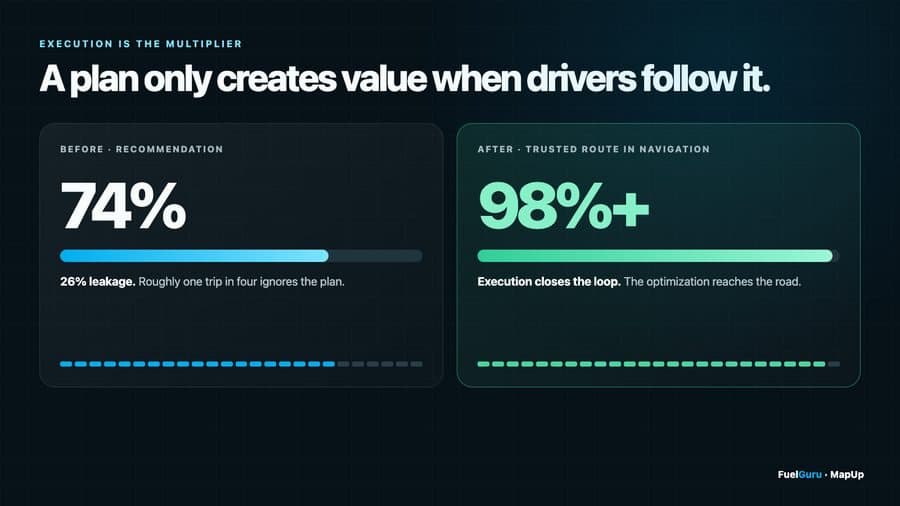
Why it moves. Once FuelGuru puts the next approved stop, and the gallons to buy there, in front of the driver at dispatch, the reason to stop at the first pump on the road goes away. Off-network fills are flagged the same day and feed the driver scorecard the fleet reviews with its drivers. That loop, not the software alone, takes the rate from the 70s to the high 90s. The premium falls as compliance rises, because the first fills to move are the expensive ones, full tanks at retail; what is left at 98 percent is a thin tail of short, forced fills.
This table does not test whether the driver fueled at the stop FuelGuru prescribed. That is measurement 3.
3. Prescription compliance
Prescribed against actual, per driver, per stop, per trip, from card transactions matched to the active prescription at the time of purchase. The rules are explicit so the number is arguable only on data, never on definition.
| Rule | How it is applied |
|---|---|
| Which prescription | The version active at the time of purchase. Revisions after the fill are never counted against the driver |
| Right stop | The prescribed station, or an allowed substitute within the distance tolerance the fleet sets |
| Right gallons | Within the gallon tolerance of the prescribed quantity; tractor and reefer on separate lines |
| Three prices | The expected net price at prescription, the expected net price at arrival, and the actual net card price, side by side |
| Delivered | A prescription that never reached the surface is an integration finding, not a driver miss |
| Attribution | A dispatch change, a blocked stop or a safety reroute re-baselines the prescription and is attributed to the system. A driver-initiated deviation carries the detour, the extra cost and the reason code, if the fleet asks for one at the next stop |
Every miss carries a cause where it can be determined: not delivered, driver chose another stop, price changed, station unavailable, tank or hours changed, out of network, over- or under-fill, or a match failure between station and transaction. The exception list groups misses by cause with the opportunity dollars, the gallons, an owner and a status, so the fuel manager works a queue rather than a percentage.
Two compliance numbers, not one
In-network compliance asks whether the fuel was bought on the network. Prescription compliance asks whether it was bought at the prescribed stop. A driver can be in network at every fill and still have ignored the better in-network stop. Report both.
4. Receipts that do not fit the truck
Two checks run on every receipt against telematics. Flagged receipts are excluded from every saving figure and reported to the fleet with the evidence, so the saving is a number the fleet's own fuel manager can defend.
| Check | Question | Usual explanation |
|---|---|---|
| Receipt while the truck was elsewhere | Was the truck's GPS anywhere near the stop on the day of the receipt? | A mislabeled unit on the card, a driver fueling another truck on this card, or fuel pumped into a different tank under this truck's item |
| Bought more than the tank had room for | Receipt gallons against the room left in the tank since the previous proven-full fill, from engine fuel level and the configured tank size | A larger tank than configured, an auxiliary tank under the truck item, or an engine sensor fault |
Each row is assessed automatically and, when you open it, shows the receipt fields, the GPS pings or the fuel level arithmetic, and the assessment. The pump receipt is the evidence the fleet checks. The same checks are how fleets catch card misuse, so they are part of the product, not a caveat on it.
5. Rebuilding the annual figure
A savings report should let the reader go from operational data to the financial result in two lines, one per lever, and then add them. Nothing in the rebuild depends on a discount the fleet does not already hold or on a stop the fleet has not already approved.
| Lever | Rebuild | Inputs a fleet can check on its own data |
|---|---|---|
| Stop and day selection | Gallons burned per truck per year multiplied by the cents-per-gallon gap on gallons burned, from the scorecard window; projected at the window's miles, prices and fueling pattern with every FuelGuru fill taken | Gallons per truck; the cents-per-gallon gap on the fleet's own price file |
| In-network compliance | Road gallons (yard fuel is in-network by construction) multiplied by the fall in off-network share, before FuelGuru to steady state, multiplied by the off-network premium per gallon | The off-network share before FuelGuru; the steady-state share; the premium, using the lowest measured month as the steady-state figure |
Then state whether the two overlap before adding them. Here they do not: the first is priced with every fill already in network; the second measures how much fuel is in network at all. Per-truck figures multiply by fleet size; they do not multiply by the best lane across every truck.
Rules that keep the number credible
Matched by lane, vehicle class and service window. Added miles, driver time and operating cost deducted. Dispatch changes attributed separately from driver deviations. Toll and fuel savings never counted on the same miles or gallons twice. Projections on the fleet's actual lane mix, never the best lane multiplied across every truck. Trucks with a negative result included.
6. Lanes, stations and states
Some opportunities repeat because the same lanes repeat. The lane, station and state views make them visible in a way one transaction at a time never is.
- Top lanes, corridors and hubs: trips, gallons, actual against prescribed cost, saving per trip and per thousand miles. The lane with the most trips is not always the lane with the most saving; rankings switch between total saving, saving per trip, gallons and repeatability.
- Station league, both sides: where the gallons were bought and where FuelGuru would buy them, with the gallon shift per stop. A stop that is prescribed often and used rarely is a network question, not a driver question.
- State price ladder: your price file averaged over the window, cheapest state first, with the low and high seen and each side's paid price in that state. FuelGuru pays below the driver in every state where both sides buy meaningful gallons. It is a pattern to act on, not a rule to route by.
- Drivers and trucks: ranked per eligible gallon with a minimum sample size, so a short-cycle truck that fuels at a yard every cycle is not compared with a long-lane truck crossing the largest price differences. Both are in the fleet figure; the ranking says where the opportunity sits.
7. Before and after a rollout
For a production rollout, keep the same trucks, lanes and periods on both sides. Before: what drivers did prior to FuelGuru, from the same card and GPS data. After: in-network share, prescription compliance, off-network gallons, price paid per gallon, missed opportunity by cause, and adoption (loads with a prescription delivered). Use comparable populations and periods, and read the first month at fleet scale as the baseline for compliance.
The weekly savings email carries these lines to your operations and finance sponsors every Monday, every number from production data, with what the whole fleet would save at 50, 75 and 100 percent of eligible loads on its own lane mix. The lane analysis is the same arithmetic run on history before you deploy anything.